iData Global Courses
Power BI data visualization real project
Power BI data visualization real project
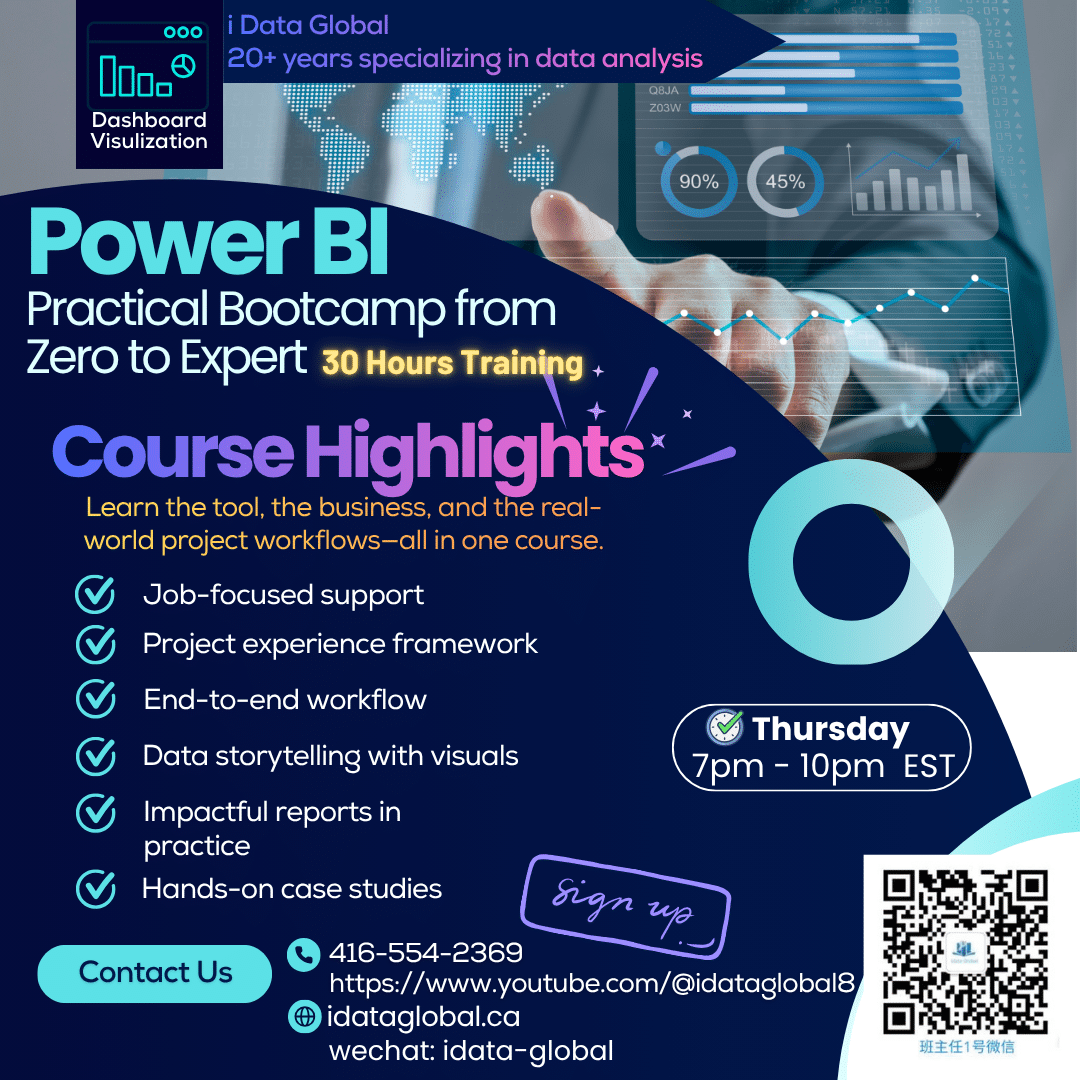
30-Hour Power BI Practical Bootcamp: From Zero to Advanced
This 30-hour Power BI bootcamp takes you from absolute beginner to advanced, real-world application.
You will not only learn the tool itself, but also the business context, typical use cases, and hands-on project workflows that mirror real workplace scenarios.
Key Highlights
- End-to-end workflow: From choosing the right visuals to building and interpreting them, you will learn the complete process of turning raw data into clear business insights.
- Data storytelling with visuals: Master storytelling techniques that make your dashboards speak for themselves and help stakeholders “see” the message in the data.
- Impactful reports in practice: Live demonstrations on how to design dashboards and reports that are both visually compelling and highly persuasive.
- Hands-on case studies: Work through classic analytics scenarios step by step, learning by doing and improving your ability to apply Power BI in real projects.
- Project experience framework: A structured project system that helps you simulate 3–5 years of practical experience, strengthening your portfolio and résumé.
- Job-focused support: CV refinement and interview coaching to help you craft a strong, coherent career story around your Power BI skills and project experience.
Course Introduction
What Is Power BI?
Power BI is a powerful Business Intelligence (BI) tool developed by Microsoft, designed for data visualization and business analytics. It allows users to easily connect to multiple data sources, build interactive dashboards and reports, and perform real-time analysis.
It integrates deeply with Excel and SQL, supports drag-and-drop visualization, and is beginner-friendly while still providing advanced capabilities such as DAX and data modeling for professional analysts.
Where Power BI Is Used
- Data-driven business decision-making
- KPI dashboards and performance monitoring
- Financial, sales, and marketing analysis
- Operations, inventory, and supply-chain analytics
Why Learn Power BI?
Power BI is one of the most widely adopted analytics tools in modern companies. Mastering it significantly improves your data visualization, analytical reasoning, and overall professional competitiveness.
Power BI Training at iData Global
iData Global offers a professional and comprehensive Power BI training program that covers:
- Data Modeling
- DAX (Data Analysis Expressions)
- Power Query data preparation
- Professional dashboard and interactive report design
With a structured learning path, students can quickly build strong visualization and analytical skills—building a solid foundation for becoming a high-level data analyst.
Course Outline
Tool Introduction
What Is Power BI?
Power BI is a powerful Business Intelligence (BI) tool developed by Microsoft, designed for data visualization and business analytics. It allows users to easily connect to multiple data sources, build interactive dashboards and reports, and perform real-time analysis.
It integrates deeply with Excel and SQL, supports drag-and-drop visualization, and is beginner-friendly while still providing advanced capabilities such as DAX and data modeling for professional analysts.
Where Power BI Is Used
- Data-driven business decision-making
- KPI dashboards and performance monitoring
- Financial, sales, and marketing analysis
- Operations, inventory, and supply-chain analytics
Why Learn Power BI?
Power BI is one of the most widely adopted analytics tools in modern companies. Mastering it significantly improves your data visualization, analytical reasoning, and overall professional competitiveness.
Power BI Training at iData Global
iData Global offers a professional and comprehensive Power BI training program that covers:
- Data Modeling
- DAX (Data Analysis Expressions)
- Power Query data preparation
- Professional dashboard and interactive report design
With a structured learning path, students can quickly build strong visualization and analytical skills—building a solid foundation for becoming a high-level data analyst.
Related Courses
-
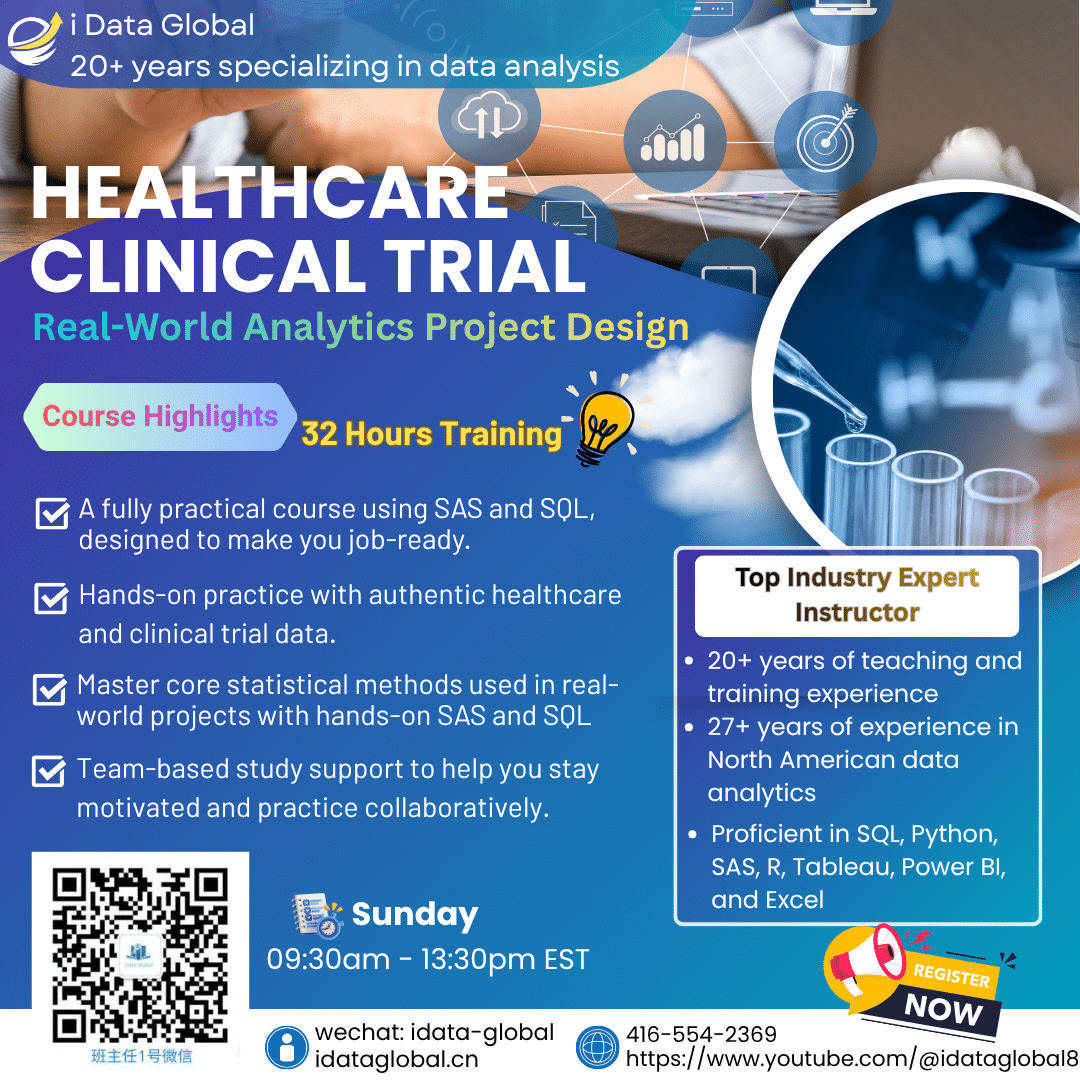
Clinical Data Analysis and Statistical Analysis (USING PHARMACEUTICAL DATA)
Course Package 2 $1,999.00Quick View -

Power BI Certificate (20 hours)
Free Courses$799.00Original price was: $799.00.$0.00Current price is: $0.00.Quick View -

Data Analyst & Data Scientist Job-Guaranteed Career Accelerator
Flagship CourseQuick View -
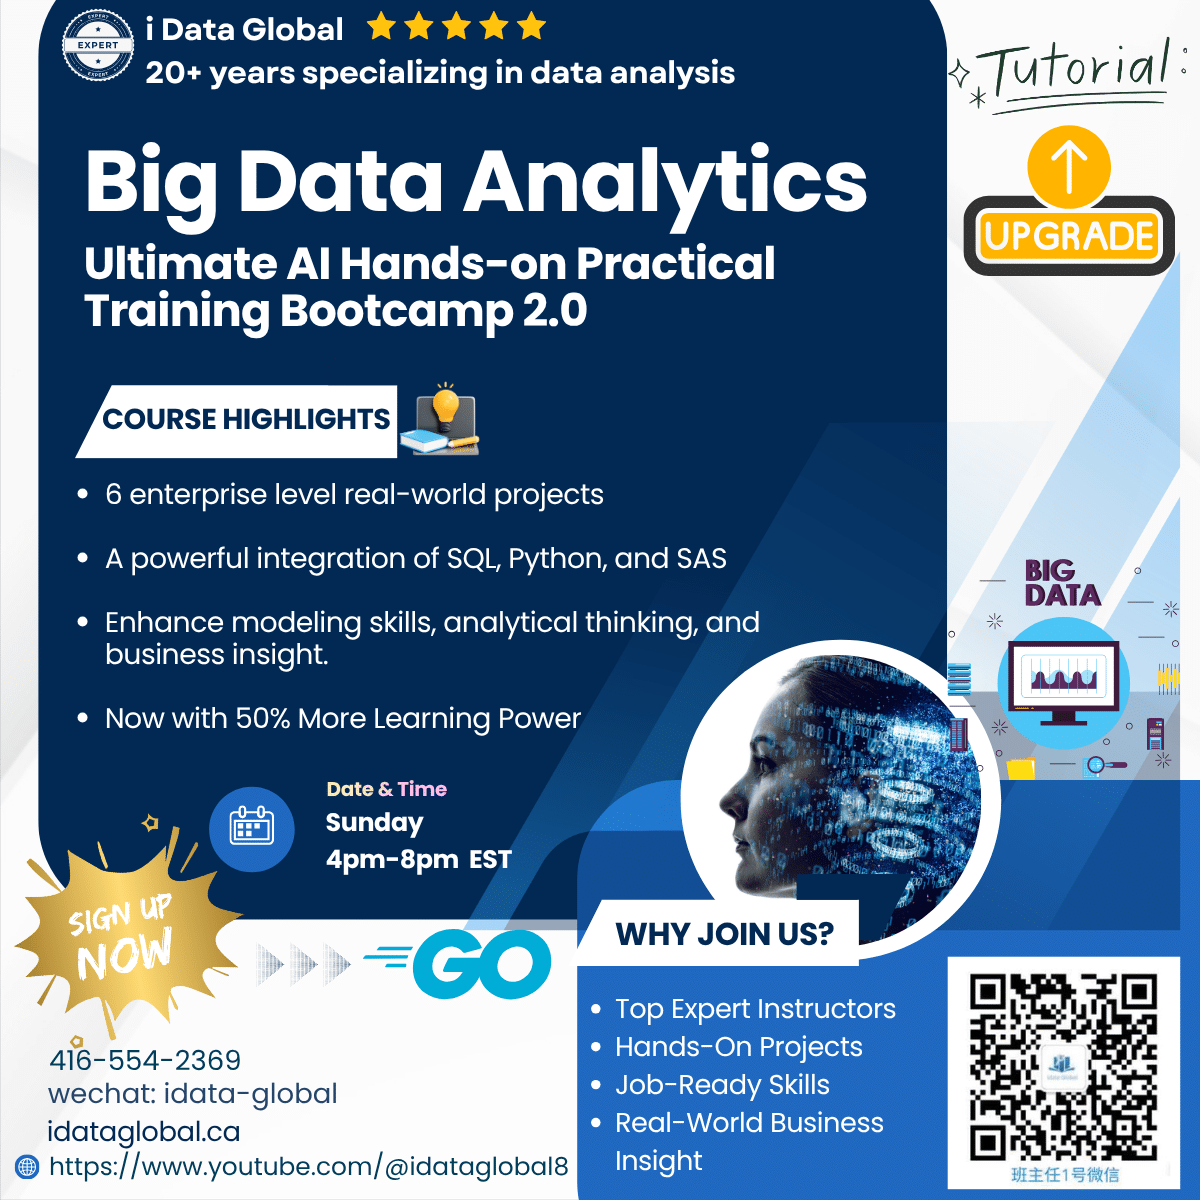
AI | Machine Learning | Statistical Modeling | Big Data Analytics — The Ultimate Hands-On Bootcamp, Newly Upgraded!
Course Package 2 $1,999.00Quick View -
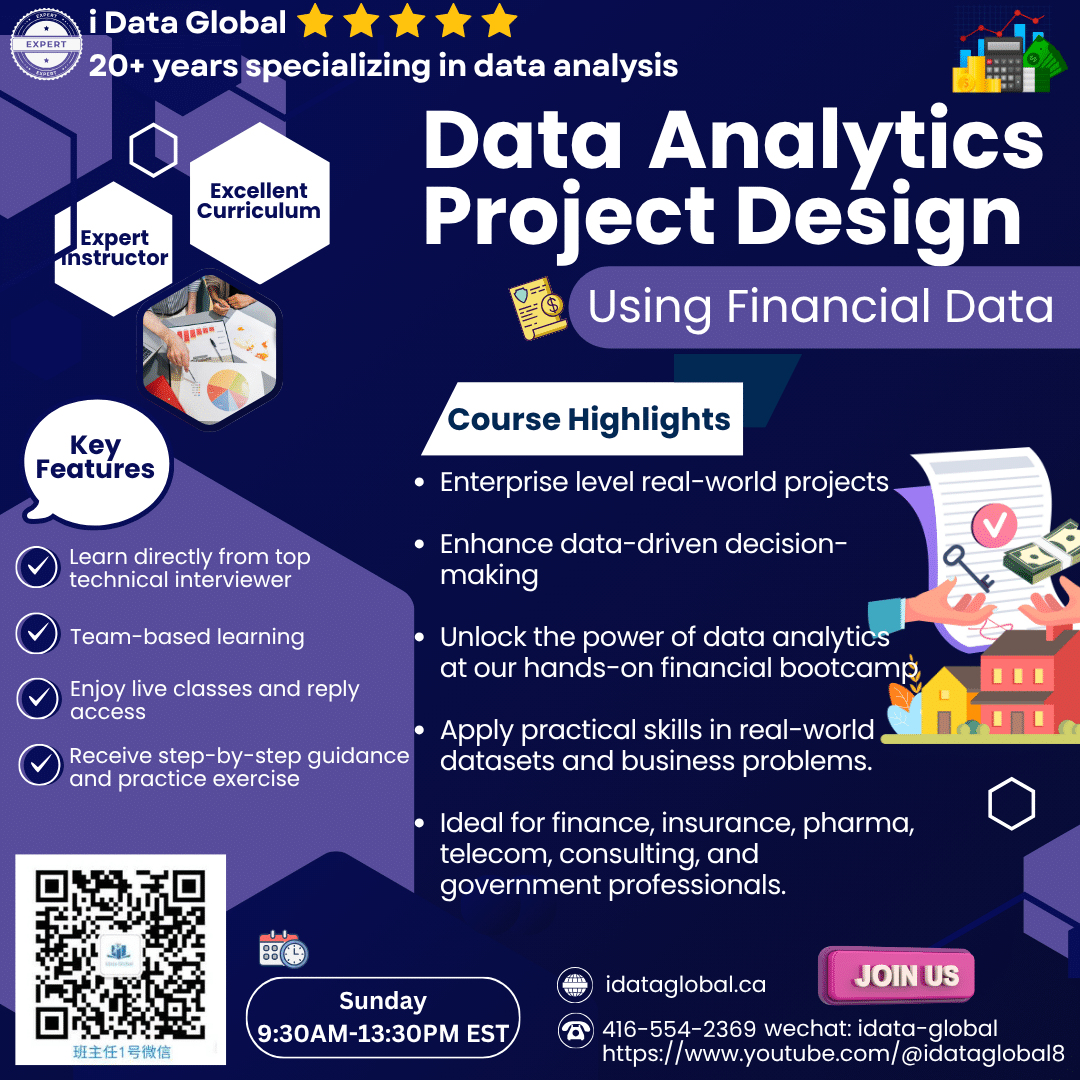
Data Analytics Project Design and Process (using financial data) /Project Design by Requirements
Course Package 2 $1,999.00Quick View
