Contents
- Academic statistics: 都有哪些内容
- Academic statistics: 数学基础
- 工作中的统计:哪些最重要?
- 我是文科生, 我能学会吗?
- 工作中的统计:如何学?
Academic statistics: 都有哪些内容
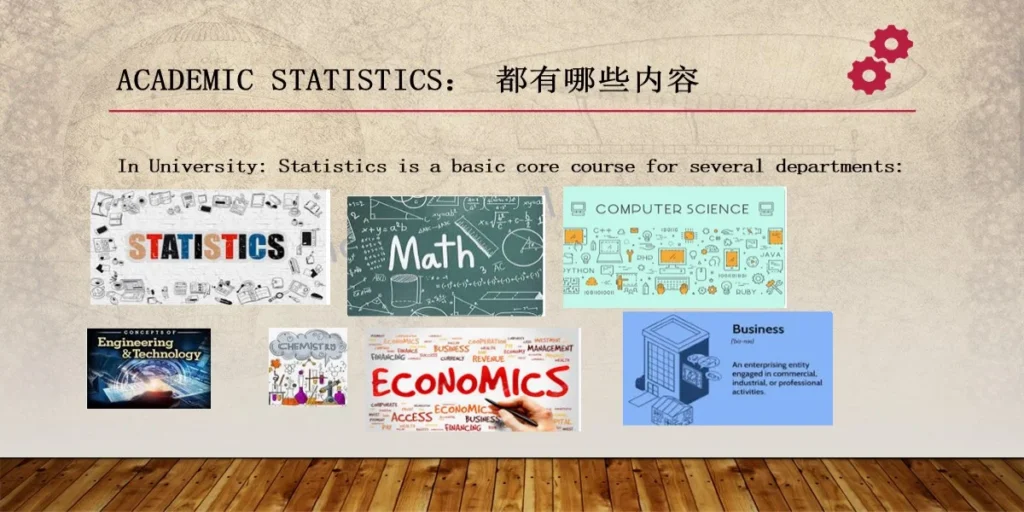
- In University: Statistics is a basic course for several departments:
Academic statistics: 都有哪些内容
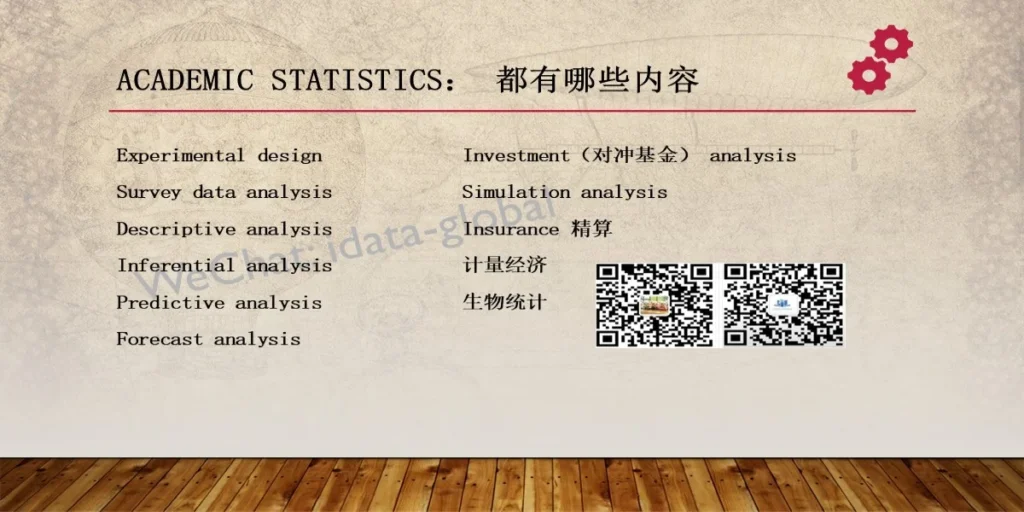
- Experimental design
- Survey data analysis
- Descriptive analysis
- Inferential analysis
- Predictive analysis
- Forecast analysis
Academic statistics: 都有哪些内容
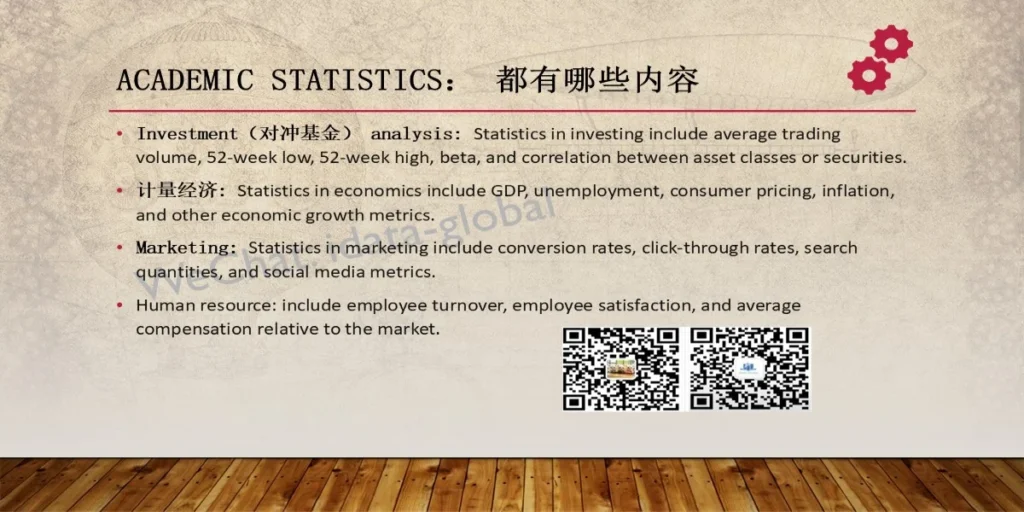
- Investment(对冲基金)analysis: Statistics in investing include average trading volume, 52-week low, 52-week high, beta, and correlation between asset classes or securities.
- 计量经济: Statistics in economics include GDP, unemployment, consumer pricing, inflation, and other economic growth metrics.
- Marketing: Statistics in marketing include conversion rates, click-through rates, search quantities, and social media metrics.
- Human resource: include employee turnover, employee satisfaction, and average compensation relative to the market.
Academic statistics:数学基础
- Differential and integral calculus: 微积分
- Linear algebra: 线性代数
- Probability theory: 概率理论
Academic statistics vs 工作中统计
- Academic statistics: 推理的严谨,数学理论的学习与应用;Write program , from the ground. Academic statistics是为了degree
- 工作中统计: 在数据分析software的帮助下为company提供solution,为公司创造价值
工作中的统计
- Marketing research:
- Survey data analysis:
- Descriptive analysis
- Predictive modelling
- AI-deep learning
- Forecast
工作中的统计
- Marketing research: product design, select functionality and price; customer satisfactory
- Survey data analysis: social analysis; opinion about a special event
- Descriptive analysis: dashboard design
- Predictive modelling: machine learning- predict probabilities
- AI-deep learning: image processing, 智能text、语音生成,spam email detect
- Forecast: forecast sale, revenue, planning and budget, etc
工作中的统计
- Understanding basic statistics is necessary
- Know well what software can help you complete these statistics
- Understand how to use procedures, options,
- Business cases are important.
工作中的统计– Descriptive analysis
- Ad hoc analysis;
- Dashboard design.
- Processing software: SAS, SQL, Python, R.
- Calculating KPI: based on business definition, calculating KPI by SAS, SQL, Python, R
- Display results: SAS/python/R programming, tableau, power bi, excel
工作中的统计– Survey/marketing research
- Business scenario, product features,
- Design questions: Microsoft word, tools for special fields
- Analyzing data: SAS/STAT, SPSS
- Display results: SAS/python/R programming, tableau, power bi, excel
工作中的统计– Predictive modelling
- Business scenario,
- Analyzing data: SAS/STAT, SPSS/IBM statistics, Python
- Display results: SAS/python/R programming, tableau, power bi, excel
工作中的统计– AI-deep learning
- Business scenario,
- Analyzing data: SAS/Viya, IBM Watson studio, Python, Tensorflow, Keras
- Display results: SAS/python/R programming, tableau, power bi, excel
工作中的统计– forecast—planning, budget
- Business scenario,
- Preparing data: SAS/Base, SAS/SQL, python, R
- Analyzing data: SAS/ETS, Tableau, power bi, excel
- Display results: tableau, power bi, excel
Teaching yourself statistics?
- Elemental statistics: high school level, You can teach yourself
- Academic statistics: university/graduate difficult to learning by yourself,
- if you have (a)微积分 ; (b)线性代数; (c)概率理论
工作中的统计:
- Elemental statistics/basic concept—you may teach yourself
- Inferential/predictive/forecast/deep learning- difficult to 自学
- Application of Software: working experience
- Business scenario: working experience
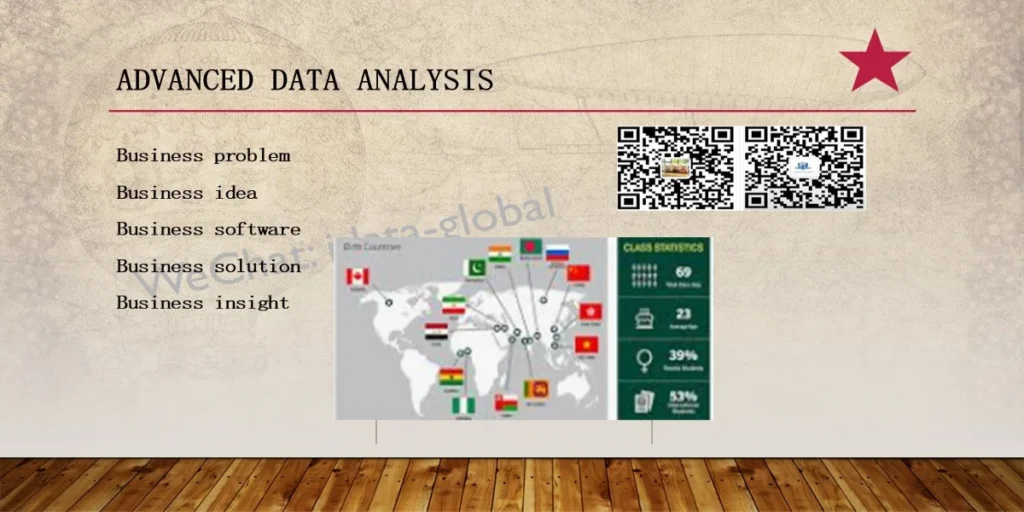
Advanced data analysis
- Business problem
- Business idea
- Business software
- Business solution
- Business insight