Data Analysis–Correlation analysis

Contents
- What is correlation analysis
- Why correlation analysis
- Correlation types
- How correlation support business
- Conclusion
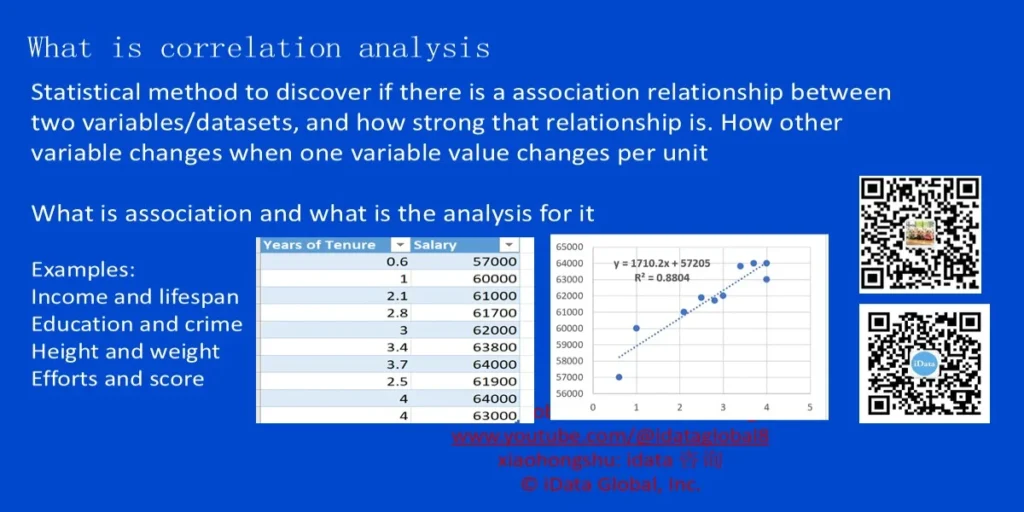
What is correlation analysis
Statistical method to discover if there is an association relationship between two variables/datasets, and how strong that relationship is. How other variable changes when one variable value changes per unit.
What is association and what is the analysis for it
- Examples:
- Income and lifespan
- Education and crime
- Height and weight
- Efforts and score
Why correlation analysis
- Dissect the big problem into small factors
- How to become an popular Instagram star
- What are the factors may help to become more popular?
- Solve conflict using analysis result
- What is the cause of the sales decrease
- Correlation analysis will show how the sales Staff and marketing channel impact the sales
- Support prioritization business strategies
- Which factors impact the sales more
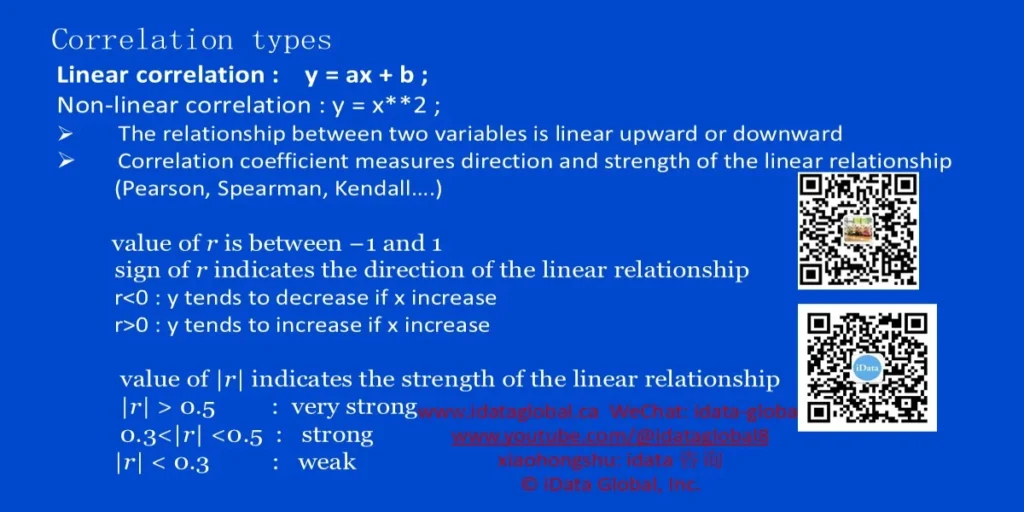
Correlation types
- Linear correlation: y = ax + b
- Non-linear correlation: y = x**2
The relationship between two variables is linear upward or downward
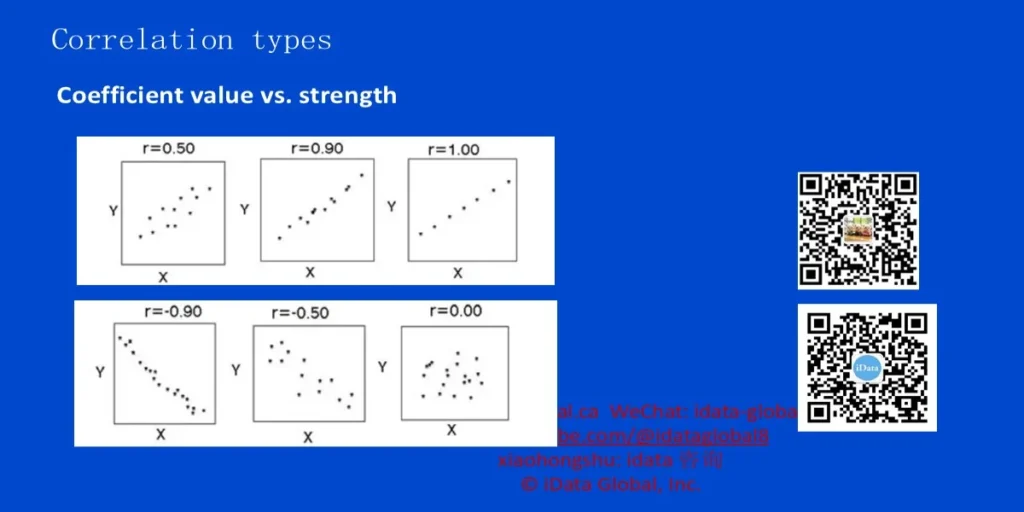
- Correlation coefficient measures direction and strength of the linear relationship
- (Pearson, Spearman, Kendall…)
- Value of r is between −1 and 1
- Sign of r indicates the direction of the linear relationship
- r<0: y tends to decrease if x increase
- r>0: y tends to increase if x increase
- Value of |r| indicates the strength of the linear relationship
- |r| > 0.5: very strong
- 0.3<|r| <0.5: strong
- |r| < 0.3: weak
Correlation types
- Coefficient value vs. strength
Correlation types
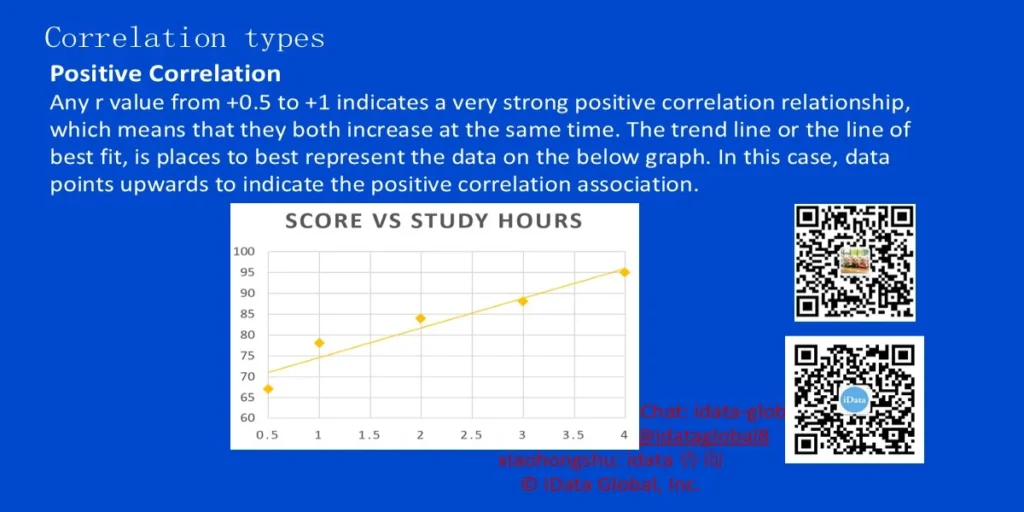
Positive Correlation
Any r value from +0.5 to +1 indicates a very strong positive correlation relationship, which means that they both increase at the same time. The trend line or the line of best fit, is places to best represent the data on the below graph. In this case, data points upwards to indicate the positive correlation association.
Correlation types
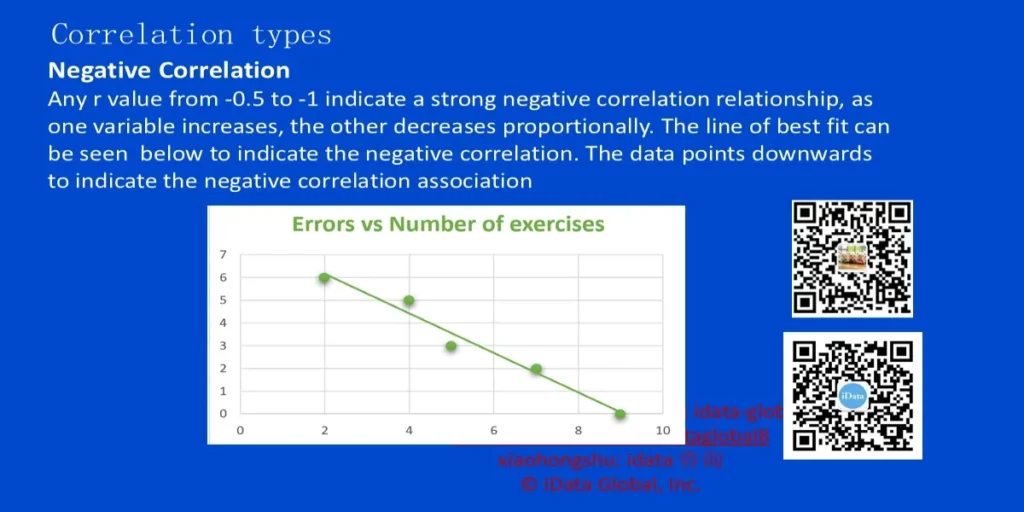
Negative Correlation
Any r value from -0.5 to -1 indicates a strong negative correlation relationship, as one variable increases, the other decreases proportionally. The line of best fit can be seen below to indicate the negative correlation. The data points downwards to indicate the negative correlation association.
Correlation types
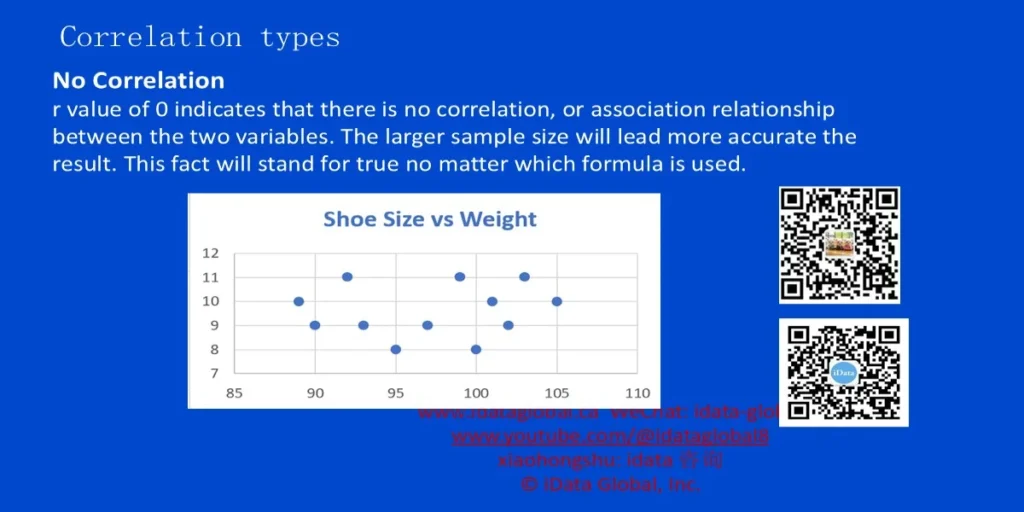
No Correlation
r value of 0 indicates that there is no correlation, or association relationship between the two variables. The larger sample size will lead more accurate the result. This fact will stand for true no matter which formula is used.
Correlation Analysis for business
Application of correlation analysis: support business and actions
- Google forecast flu in 2025 based on data between 2003 and 2024
- Time, location, searched key words, …
- Salary for employee with certain tenure
- Facebook user retention
- Profit and price changes
- SAS Advanced certificate exam score based on Base certificate exam score
Correlation Analysis – Conclusion
- To dissect the problem / issue
- Discover the relationship between two variables
- Business scenarios
- Two types: (1) Linear; (2) non-linear
- Value of r represent how strong the relationship is
- Correlation <> Causation
Correlation Analysis – Tools
- SAS
- Power bi
- Tableau
- Excel


